고정 헤더 영역
상세 컨텐츠
본문
728x90
알고리즘 코드카타
문제 20.
함수 solution은 정수 n을 매개변수로 입력받습니다. n의 각 자릿수를 큰것부터 작은 순으로 정렬한 새로운 정수를 리턴해주세요. 예를들어 n이 118372면 873211을 리턴하면 됩니다.
def solution(n):
    answer = str(n)
    answer= ''.join(sorted(answer,reverse=True))
    return int(answer)
str 문자형으로 변환.
sorted()
https://blockdmask.tistory.com/466
[python] 파이썬 정렬 sorted 함수 정리 및 예제
안녕하세요. BlockDMask입니다. 오늘은 데이터를 정렬해주는 sorted 함수에 대해서 알아보려고 합니다. 혹시 리스트의 sort 함수를 생각하고 들어오신 분들은 [바로가기] 해당 포스팅에 리스트 정렬 so
blockdmask.tistory.com
join 메서드
https://needneo.tistory.com/92
[Python] 파이썬 리스트 문자열 합치기 Join 함수
Join함수는 리스트로 되어 있는 문자열 데이터들을 설정한 구분자(separator)로 구분하여 문자열 형태로 반환하는 내장 함수이다. 문자열을 리스트 형태로 나누는 것을 split 함수라고 한다면, 리스
needneo.tistory.com
문제 21.
양의 정수 x가 하샤드 수이려면 x의 자릿수의 합으로 x가 나누어져야 합니다. 예를 들어 18의 자릿수 합은 1+8=9이고, 18은 9로 나누어 떨어지므로 18은 하샤드 수입니다. 자연수 x를 입력받아 x가 하샤드 수인지 아닌지 검사하는 함수, solution을 완성해주세요.
def solution(x):
    sum=0
    for i in str(x):
        sum += int(i)
    if x%sum==0:
        return True
    else:
        return False
데이터 전처리, 시각화 강의
3주차
df.iloc[0:5:2]
#인덱스 0부터 5개, 하나씩 건너뛰고

df.iloc[0::2]
#인덱스0 부터 한칸씩 건너뛰고 끝까지
df.iloc[0,0]
#1행의 1열 값
df.iloc[0,0:2]
#1행의 1,2번 값
loc 숫자 말고 이름으로. 별도의 인덱스 필요
df.loc[:]
#전체 데이터

df.loc[:,'A']
#전체 데이터 중 A 컬럼에 해당하는 데이터

df.loc['b':'d','A':'B']
#앞: 인덱스 명, 뒤: 컬럼명
iloc;마지막 값 포함 x . df.iloc[0:2] --> 인덱스 0,1
loc;마지막 값 포함. df.loc['A':'B'] --> 인덱스'B'도 포함
slicing& selection
df[['a','b']]
#두 가지 컬럼 선택할 경우 대괄호로 묶어줌
불리언 인덱싱
df[df['sex']=='Male']
#남성인 데이터/ 해당 조건이 참인 데이터

df[df['sex']=='Male') & (df['smoker']=='Yes')]
#조건 두개 이상; 소괄호로 묶어줌

#and(&) or(|)
df.loc[df['size'>3,:]
#사이즈가 3보다 큰 전체 컬럼 조회
df.loc[df['size'>3, 'tip':'smoker']
#조건에 해당하는 특정 컬럼만 조회
.isin
df[df['size'.isin{[1,2]}]
#특정 컬럼(size)에서 특정 값(1,2)만

df[df['day'].isin{['sun','thur']}]
각 조건을 변수에 할당하여 조건을 결합.
데이터 추가하기
df['created_at']='2024-01-01'
#컬럼 추가

df['created_at']=pd.to_datetime(df['created_at']
#날짜로 데이터 타입 변경 후 컬럼에 값 할당
데이터 연산
df['revenue']=df['totall_bill']+df['tip']
#별도의 컬럼을 파서 연산 값을 할당

df['tip_percentage']=df['tip']/df['revenue']*100
#퍼센티지 계산
데이터 병합
concat
pd.concat([df1,df2,df3], axis=0).reset_index(drop=True)
#세개의 데이터 프레임을 위 아래로 병합.
#기본값 인덱스가 유지
#따라서 인덱스 리셋
#axis 기본 값 위아래 axis=1:양옆
각 데이터 프레임의 크기가 맞지 않을 경우, 빈값은 NAN으로 나타남
merge:특정 컬럼을 고려하여 데이터를 병합
pd.merge(df1,df2, on =’key’, how=’inner’)
#on ='병합의 기준이 되는 컬럼'
#how
#inner -> 'key' 컬럼을 기준으로 동일한, 겹치는 데이터 프레임
#outer-> 'key' 컬럼을 기준으로 두 데이터 프레임 모두
#left 왼쪽을 기준으로 왼쪽 값 유지 +df2에도 속하는 값 넣어주기
데이터 집계
group by
df.groupby(‘category’).mean()
#카테고리를 기준으로 그룹 바이,평균 집계
#카테고리가 인덱스로 변환됨
.sum()
.count() --개수
.max() --최대값
.min() --최솟값
.firtst() --첫번째에 등장하는 값
.agg(list) -- 값이 리스트 형태로 묶여서 나옴
데이터 프레임에서 산출하고자 하는 값 선택(숫자형만)

그룹 바이 내에 리스트 형태로 묶으면 둘다 인덱스로 들어감.
df[[‘sex’,‘day’,’total_bill,’tip’,’size’]].groupby ([‘sex’,‘day’]).agg({‘totall_bill’:
Max’,’tip’:’mean’,’size’:’sum”})
#컬럼 별로 다른 값 집계하기
pivot table

인덱스, 컬럼, 연산할 값, 연산 방식
--일자별 각 카테고리의 밸류 값을 총합한
서브카테고리로 두 가지 컬럼. 리스트 형태로.

데이터 정렬
df.sort_values(by=’Age’,ascending=False:내림차순)
#기본값 오름차순

df.sort_values(by=[’Age’,’score’], ascending=[True,False])
#컬럼마다 다르게 가능

df.sort_index(ascending=False)
#인덱스 값으로도 정렬 가능
4주차 강의

#그래프 그리기
df.plot(x=’A’,y=’B’)
plot.show()

#스타일 설정
df.plot(x=’A’,y=’B’,color=’green’, linestyle=’--‘, marker=’o’)
plt.show()

#범례 추가하기
1) df.plot(x=’A’,y=’B’, color=’red’, linestyle=’--‘, marker=’o’, label=’data series’)


2) df.plot(x=’A’,y=’B’, color=’red’, linestyle=’--‘, marker=’o’)
ax.legend([‘data series’])

#텍스트 추가하기
ax.text(3,3,’some text’, fontsize=12)
#텍스트 위치, 텍스트, 폰트 크기

#기타
plt.figure(figuresize=(8,6))
#가로 세로 사이즈
그래프 그리기
line
data_grouped = data[['year','passengers']].groupby('year').sum().reset_index()
data_grouped

plt.plot(data_grouped['year'], data_grouped['passengers'])
plt.xlabel('year')
plt.ylabel('passengers')
plt.show()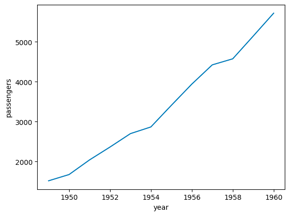
막대그래프: 범주형 데이터 각각
히스토그램: 연속적 데이터의 빈도
막대그래프
plt.bar(df['도시'],df['인구'])
plt.xlabel('도시')
plt.ylabel('인구')
plt.title('도시 별 인구 수')
히스토그램
data=np.random.randn(1000)
#numpy에서 array 1000개의 데이터 생성
plt.hist(data, bins=30)
#bins 몇 개의 구간을 둘 것인가
plt.xlabel('value')
plt.ylabel('frequency')
plt.show()
파이차트 -- 전체에서 각 부분의 비율
plt.pie(sizes, labels=labels, autopct='%1.1f%%')
#autopct= 각 부분의 백분율
plt.title('Pie Chart')
plt.show()
Box plot
데이터의 분포와 이상치(중앙값, 사분위수, 최솟값, 최댓값)-- 데이터의 통계적 특성 파악에 용이
np.random.seed(10)
data = [np.random.normal(0, std, 100) for std in range(1, 4)]

plt.boxplot(data)
plt.xlabel('Data')
plt.ylabel('Value')
plt.title('Box Plot')
plt.show()
seaborn iris 데이터
각 종이 가지는 sepal length 값 나열
species=iris['species'].unique()

sepal_lengths_list=[iris[iris['species']==s]['sepal_length'].tolist() for s in species]

plt.boxplot(sepal_lengths_list, labels=species)
plt.ylabel('Sepal Length')
plt.xlabel('species')
plt.title("Box plot")
plt.show()
seaborn 으로도 박스 플롯 만들기 가능
sns.boxplot(x='species',y='sepal_length', data=iris)
plt.show()
Scatter 산점도
두 변수간 관계를 점으로 표현(상관 분석 등에 이용)
plt.scatter(iris['petal_length'],iris['petal_width'])
plt.xlabel('Petal length')
plt.ylabel('Petal width')
plt.show()
iris.corr(numeric_only=True)
숫자 형태의 변수 값만 가지고 상관성을 나타냄


데이터 분석 과제
https://www.inflearn.com/questions/1131918/string%EA%B3%BC-object-%EC%9D%98-%EC%B0%A8%EC%9D%B4
string과 object 의 차이 - 인프런
학습 관련 질문을 남겨주세요. 상세히 작성하면 더 좋아요!질문과 관련된 영상 위치를 알려주면 더 빠르게 답변할 수 있어요먼저 유사한 질문이 있었는지 검색해보세요dtype에서 string과 object 의
www.inflearn.com
https://blog.naver.com/youji4ever/221652121166
[파이썬] 판다스(pandas) 팁6. 데이터 타입(dtype) 자유자재로 변경하기
오늘은 데이터프레임의 각 열의 데이터 타입을 자유자재로 변환할 수 있는 방법을 정리해본다. 일단 테스트...
blog.naver.com
[python] 판다스 날짜 데이터 타입 변환 - pandas / to_datetime()
to_datetime() - 판다스를 이용한 데이터 타입 변환중 날짜에 관한 함수 - 주식 데이터 중 날짜데이터들 증권사 api로 받아와 DataFrame에 저장한 후에 csv파일로 저장하면 날짜데이터의 형식은 int64로 지
hiio.tistory.com
https://rfriend.tistory.com/392
[Python pandas] 여러개의 함수를 적용하여 GroupBy 집계하기 : grouped.agg()
지난번 포스팅에서는 Python pandas의 GroupBy 집계 메소드와 함수에 대해서 알아보았습니다. 이번 포스팅에서는 Python pandas의 GroupBy 집계를 할 때 grouped.agg() 를 사용하여 다수의 함수를 적용하는 몇
rfriend.tistory.com
https://kbkb456.tistory.com/88
pandas 데이터 분석 - group by를 이용한 집계(sum, count, min, max, mean, median, std, var, quantile, describe, agg)
https://kbkb456.tistory.com/86 pandas 데이터 분석 4 - apply, map를 활용해서 컬럼 연산해보기 https://kbkb456.tistory.com/85 pandas 데이터 분석 3 - 데이터 합치기(merge, append, inner join, left outer join, right outer join, full o
kbkb456.tistory.com
https://jimmy-ai.tistory.com/331
[Pandas] 파이썬 판다스 요일 추출 방법 정리(weekday, day_name(), 한글 요일 이름)
Python pandas 데이터프레임 요일 구하기 파이썬의 판다스 모듈로 데이터프레임 내의 날짜 정보를 다룰 때, 요일 정보를 추출하는 여러 가지 방법들에 대하여 정리해보도록 하겠습니다. 이해를 돕
jimmy-ai.tistory.com
https://hyo-ue4study.tistory.com/419
[CPP] C++에서의 1e-6f 란? (과학적 표기법/scientific notation)
언리얼엔진4 소스 UCharacterMovementComponent 를 살펴보던 중 아래와 같은 변수를 발견했다. const float UCharacterMovementComponent::MIN_TICK_TIME = 1e-6f; 여기서 1e-6f은 무슨 뜻일까? 과학적 표기법(scientific notation)
hyo-ue4study.tistory.com
https://zephyrus1111.tistory.com/178
[Matplotlib] y축 눈금 숫자 형식(Number Format) 바꾸기(set_yticklabels) 백분율(%), 천단위 콤마(,), 과학적
반갑습니다~ 꽁냥이입니다. 가끔씩 y축 눈금 라벨의 숫자 형식(Number Format)을 바꾸고 싶을 때가 있는데요. 이번 포스팅에서는 Matplotlib에서 y축 눈금의 숫자 형식을 바꾸는 방법에 대해서 알아보려
zephyrus1111.tistory.com
https://kongdols-room.tistory.com/84
축(axes,axis)의 포맷팅(눈금(틱,tick), 축제목(레이블,label)) - matplotlib(9)
파이썬 버전 3.7 기준matplotlib 버전 3.0.3 기준 축(axes,axis)의 포맷팅(틱(tick), 축제목(레이블,label)) 본 포스팅에서는 플롯에서 축의 틱과, 축 제목을 편집하는 방법에 대해 다룬다.관련된 함수는 xticks
kongdols-room.tistory.com
https://matplotlib.org/stable/api/_as_gen/matplotlib.axes.Axes.ticklabel_format.html
matplotlib.axes.Axes.ticklabel_format — Matplotlib 3.8.2 documentation
Scientific notation is used only for numbers outside the range 10m to 10n (and only if the formatter is configured to use scientific notation at all). Use (0, 0) to include all numbers. Use (m, m) where m != 0 to fix the order of magnitude to 10m. The form
matplotlib.org
Kite
www.adamsmith.haus
python - 문자열 날짜(e.g. 2023-02-07)을 datetime, date 형태로 변경
결론부터 요약하자면 다음과 같습니다. from datetime import datetime date_string = "2023-02-07" parsed_date = datetime.strptime(date_string, "%Y-%m-%d") print(parsed_date) # 2023-02-07 00:00:00 print(parsed_date.date()) # 2023-02-07 datetime.
junho85.pe.kr
https://domdom.tistory.com/237
[python] 파이썬으로 날짜가 무슨 요일인지 구하기
파이썬으로 특정 날짜가 무슨 요일인지 구하는 방법입니다. 매우 쉽습니다! 일단 가지고 있는 날짜데이터가 문자열이라면 datetime형으로 변경해줍니다. 저는 오늘날짜인 2021년 10월 21일을 넣었어
domdom.tistory.com
https://matplotlib.org/stable/api/_as_gen/matplotlib.axes.Axes.ticklabel_format.html
matplotlib.axes.Axes.ticklabel_format — Matplotlib 3.8.2 documentation
Scientific notation is used only for numbers outside the range 10m to 10n (and only if the formatter is configured to use scientific notation at all). Use (0, 0) to include all numbers. Use (m, m) where m != 0 to fix the order of magnitude to 10m. The form
matplotlib.org
https://reakwon.tistory.com/172
[파이썬] 날짜(Date) 다루기 - datetime 객체와 날짜 연산, 날짜 format 출력
datetime 모듈 파이썬에서 날짜와 관련된 데이터를 다룰때에는 datetime이라는 모듈을 import 하여 사용해야합니다. datetime은 날짜와 관련된 여러가지 메소드들을 가지고 있습니다. 현재 시간 구하기(n
reakwon.tistory.com
https://brave-greenfrog.tistory.com/13
kaggle 실습 - 아웃라이어(이상치) 제거
1. 3시그마 이상치 제거 3 시그마 이상치 제거란 ? 정규분포에서 데이터들이 ±3σ 안에 포함될 확률은 무려 99.7%인데 3 시그마 규칙이란 데이터가 ±3σ 밖에 존재할 확률은 0.3%이기 때문에 이 범위
brave-greenfrog.tistory.com
날짜 포맷을 설정 안 해서 값이 요상히 나왔고,, 예시 표와 달라서,, 과학적 표기법으로 바꾸는 법을 찾아볼 수 있는 기회였다..
plt.ticklabel_format(axis='y',style='sci', scilimits=(0,0))
'TIL' 카테고리의 다른 글
| 240129월_TIL (0) | 2024.01.29 |
|---|---|
| 240126금_TIL (1) | 2024.01.26 |
| 240124수_TIL (0) | 2024.01.24 |
| 240123화_TIL (2) | 2024.01.23 |
| 240122월_TIL (1) | 2024.01.22 |


